
This help guide walks you through what's new in each tab of the Spark dashboard and how to use it. To be clear, your login and historic Spark data haven't changed, only the layout of the dashboard and a few added features.
Skip ahead for some FAQs here.
Overview
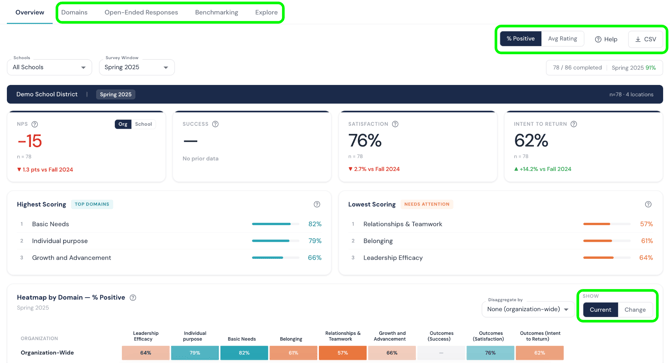
The Overview tab is your dashboard home page. It shows the same core data you're used to: your highest- and lowest-scoring domains, your participation rate, and the Spark heat map, which you can still filter by role, school, tenure, and other disaggregations.
What's new here:
-
See change over time. Above the heat map section, switch the toggle from "Current" to "Change" to compare this administration's results against a previous one. If you have administered the Spark survey multiple times, you can select which past survey you'd like to use for comparison.
-
Filter by disaggregation. Use the filter menu to break down any chart by school, role, tenure, or another category as you've used before. You can also now see your quantitative data represented as "% positive" or "average rating" (scored on a Likert scale).
-
Download your overview data. Click the download icon in the top-right corner of the page to export everything on the Overview tab as a CSV.
Downloading Slides
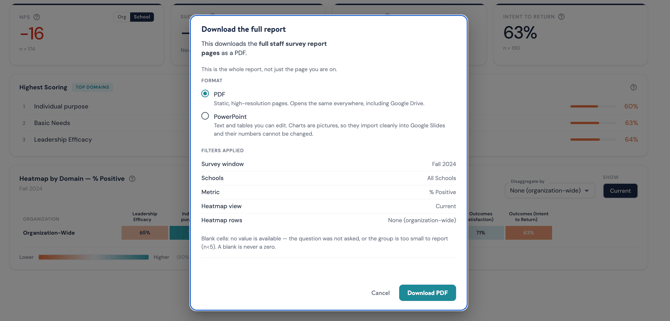
You can download a full powerpoint / PDF presentation of all your Spark data slides by clicking the PDF / PPT button in the top right of the dashboard.

You can choose between a PDF (uneditable images and charts) or a Powerpoint (with some editing ability when downloaded).
Domains
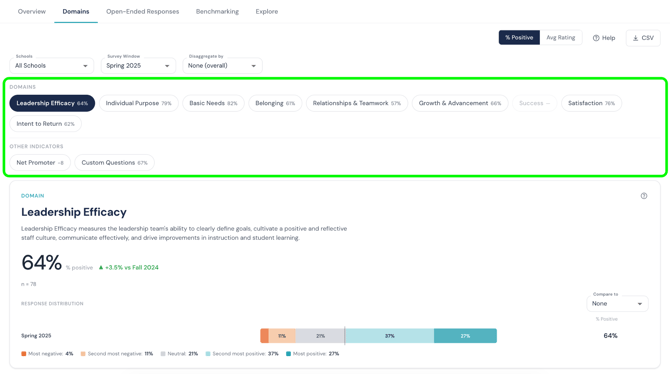
All domain-level data now lives in one place — the Domains tab — instead of being split across several pages.
To find domain data:
-
Click into any domain to see its individual questions and their scores.
-
Use the filters (school, role, tenure, etc.) to narrow the view to the group you want.
-
Toggle between "Current" and "Change" to see this administration's domain-specific scores or how they've shifted since the last survey window.
-
Click the download icon to export the filtered view as a CSV.
Open-Ended Responses
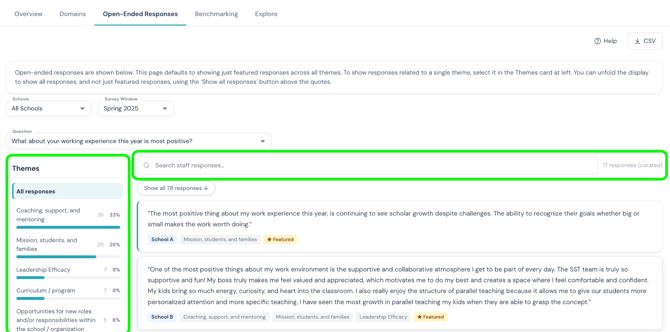
This tab houses all of your qualitative data — the open-ended comments staff left on the survey.
To review open-ended responses:
- Select a question from the dropdown list to see all responses to it.
- Click on specific themes to view quotes tagged to those themes.
- If a theme is tagged to less than 10% of quotes, those quotes will not be viewable in the dashboard. They will be included in the CSV download of all quotes.
- Quotes that are starred as Featured have been curated through Attuned's theme analysis that best represent each theme.
- Use the new search bar to find responses containing a specific keyword or phrase (for example, searching "workload" surfaces every comment that mentions it).
Benchmarking
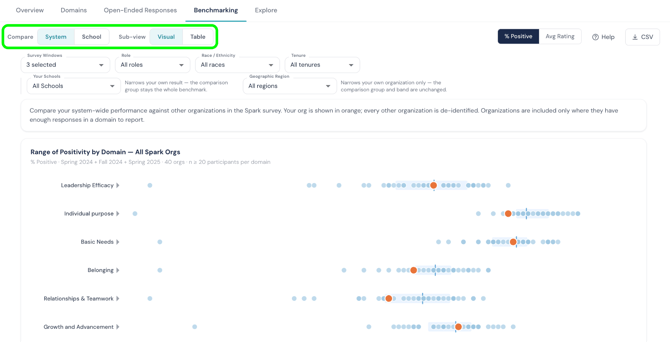
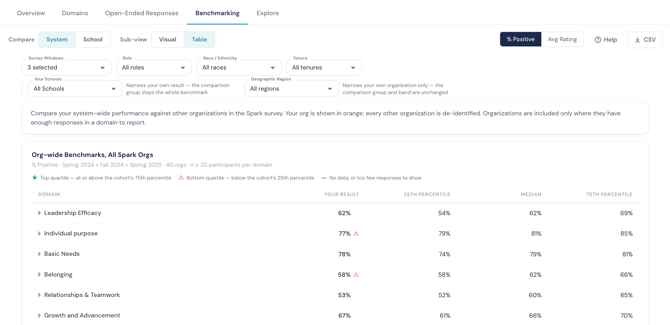
The Benchmarking tab works largely the way it did before, with two view options.
To compare your results to benchmarks:
- Choose Dot plot or Table view, however you prefer to visualize your data.
- Hover over any orange point to see the org-wide or school-specific benchmark for that domain.
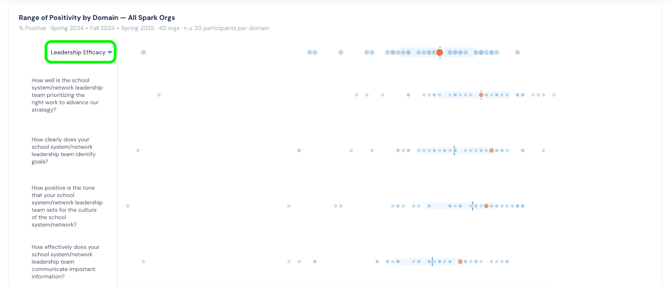
- Click a domain to expand it and see the underlying question-level data benchmarking.
Explore
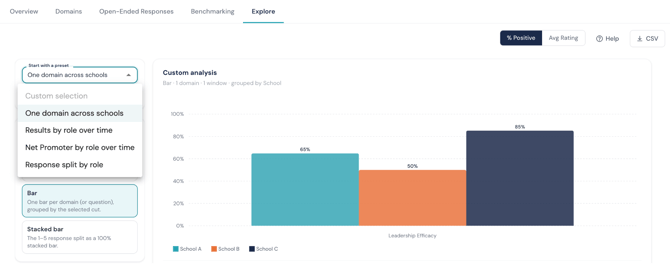
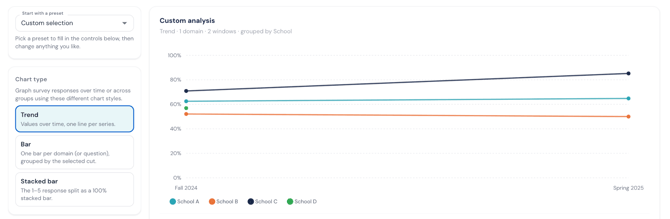
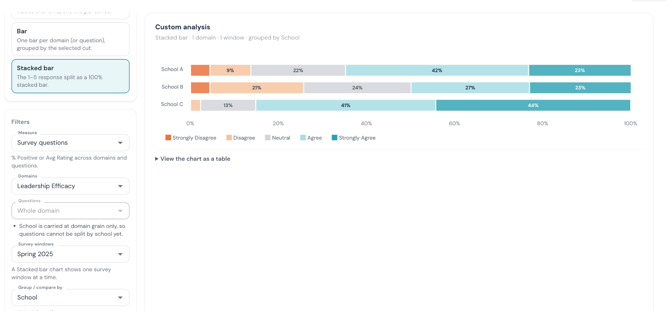
The most exciting new tab! Explore lets you build your own custom visualizations from your Spark data.
To create a custom view:
- Start with a preset from the dropdown menu. These options will continue to expand as we build out improvements to the dashboard!
- Choose a chart type (line, bar, or stacked bar).
- Apply filters to narrow the data to what you want to see in this chart (school, role, tenure, question, or domain).
- Your chart updates automatically as you adjust the chart type or filters. Experiment until you find the view that shows the data you want to analyze.
FAQs
When will I see the new dashboard?
-
Now! We've launched this new dashboard and sunsetted the previous version. There is nothing users need to do on their end to see this new dashboard.
Will my staff see this too, or just leaders?
-
All users who have had access to the Spark dashboard in the past will now see this new version. Depending on their permissions to view multiple schools, only one school, org all schools, the options to view org-wide vs. school-level data in the dashboard will differ.
What happened to the data from the last dashboard? Can I still access last year's results?
-
We've added historic Spark data to the new dashboard. Using the "Survey Window" dropdown menu at the top of the dashboard, users can see previous administration's data reflected in the new dashboard format. The "Change" toggle include the historic data as well.
Email support@attunedpartners.com with any questions about the new dashboard, or to request a live walkthrough with your team.